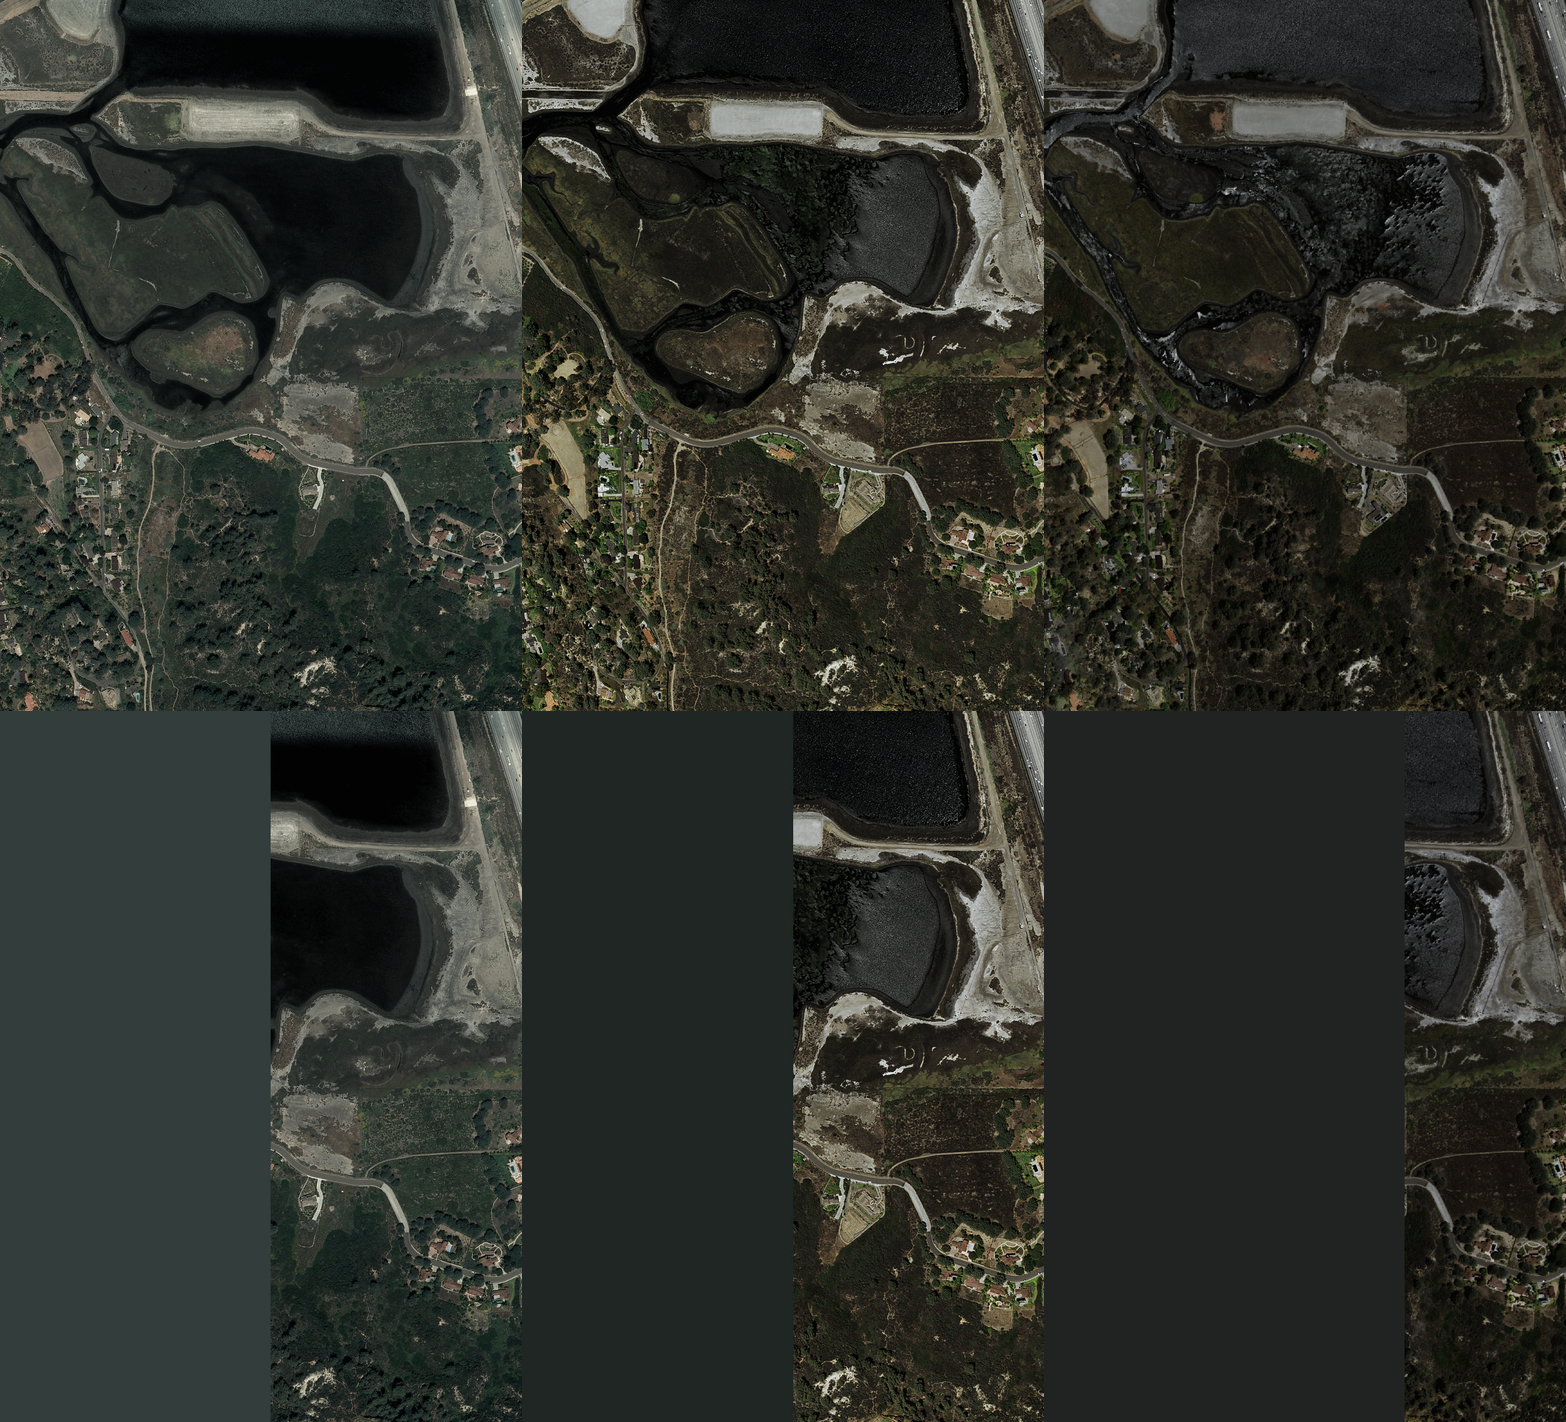
Pacific Coast
There are eight sites and 64 sub-sites:
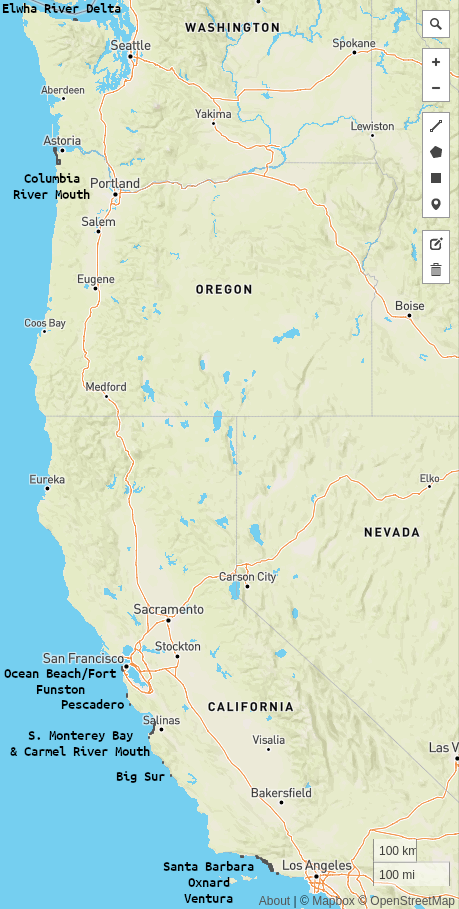
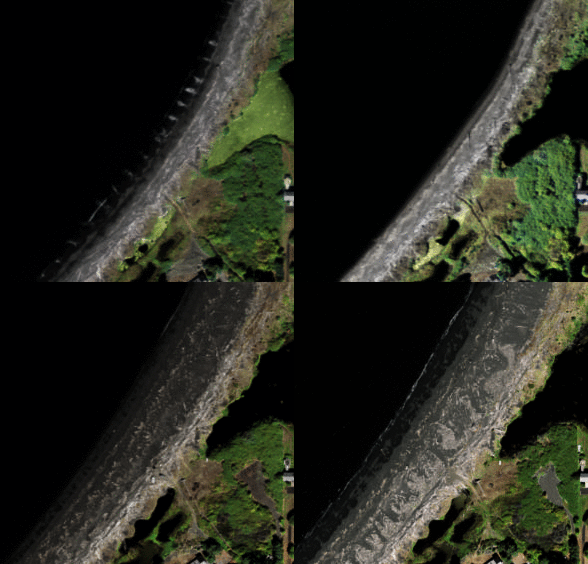
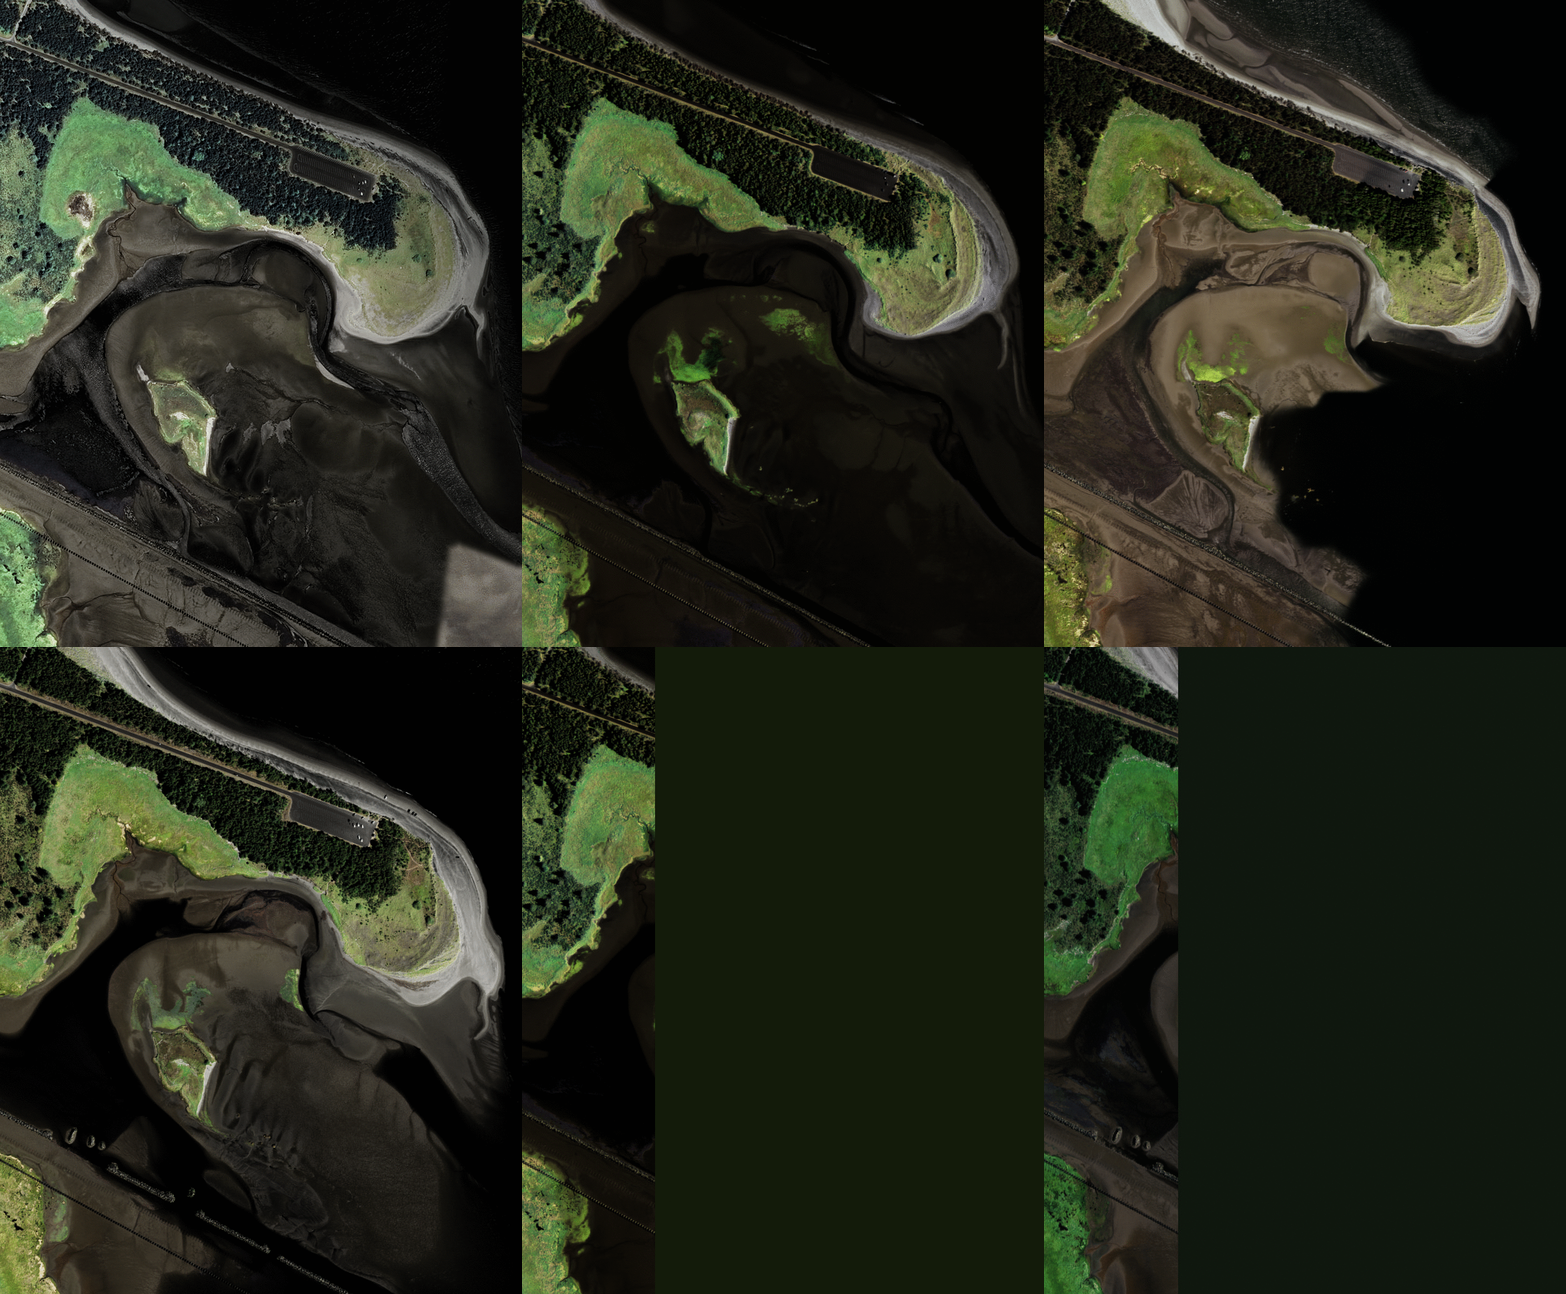
Note that all imagery here originates from the National Agriculture Imagery Program or NAIP. These 1-m pixel size scenes have been collected between Jan 1 2010 and Dec 31 2020 and are for illustration purposes only, although they do constitute a subset of the full Coast Train dataset (forthcoming).
1. Elwha
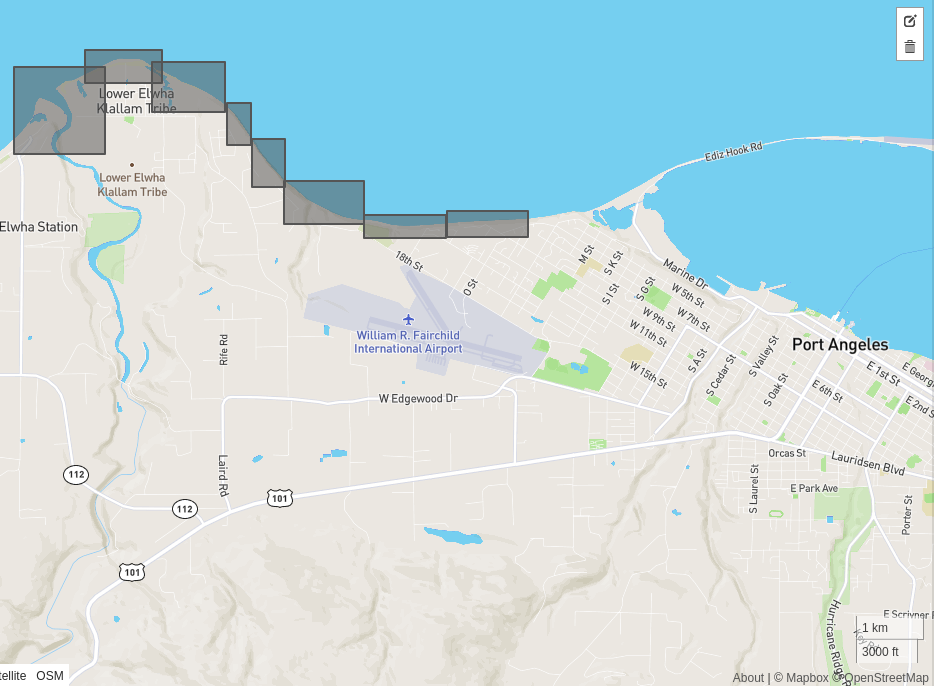
See this page for more details about Elwha River monitoring efforts
Example 1: -123.566253662, 48.143983157
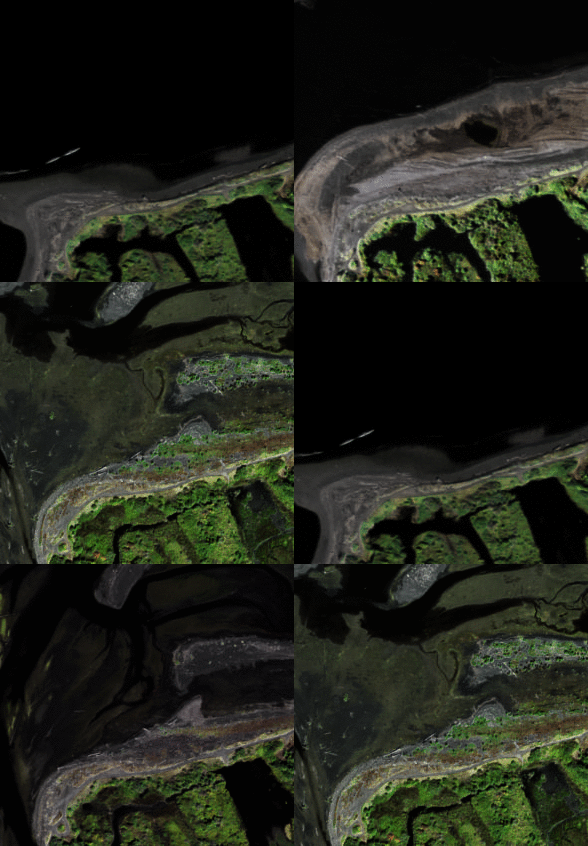
Example 2: -123.566253662, 48.143983157
2. Columbia River Mouth

This this report for more details about Columbia River monitoring efforts
Example 1:-123.929763793, 46.000673575

Example 2: -124.003509521, 46.203592844
3. Ocean Beach and Fort Funston
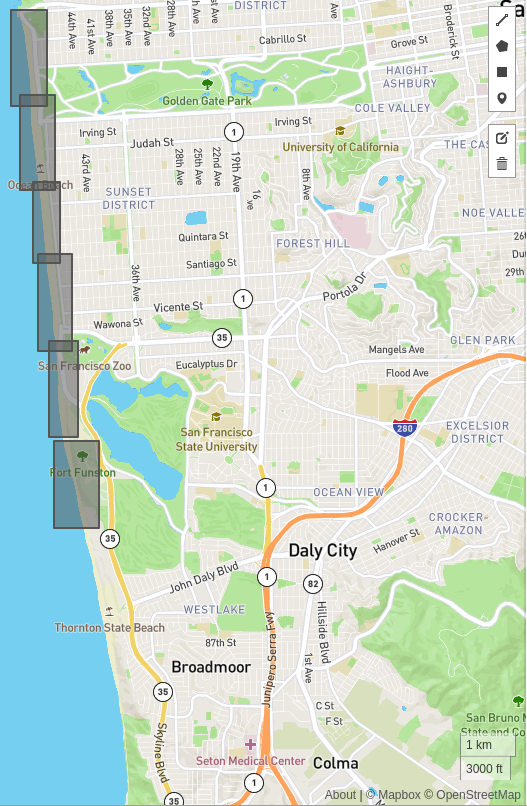
This this report for more details about ongoing Ocean Beach / Fort Funston region monitoring efforts
Example 1: -122.508441925, 37.738113850

Example 2: -122.504940032, 37.713538596
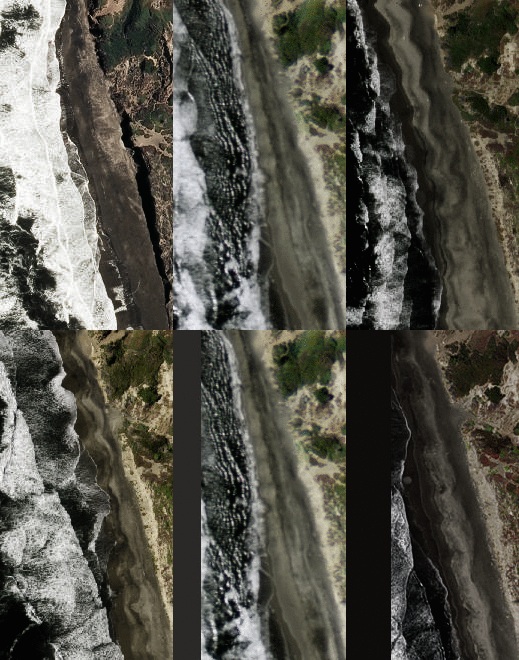
4. Pescadero

Example 1: -122.409667968. 37.284323315
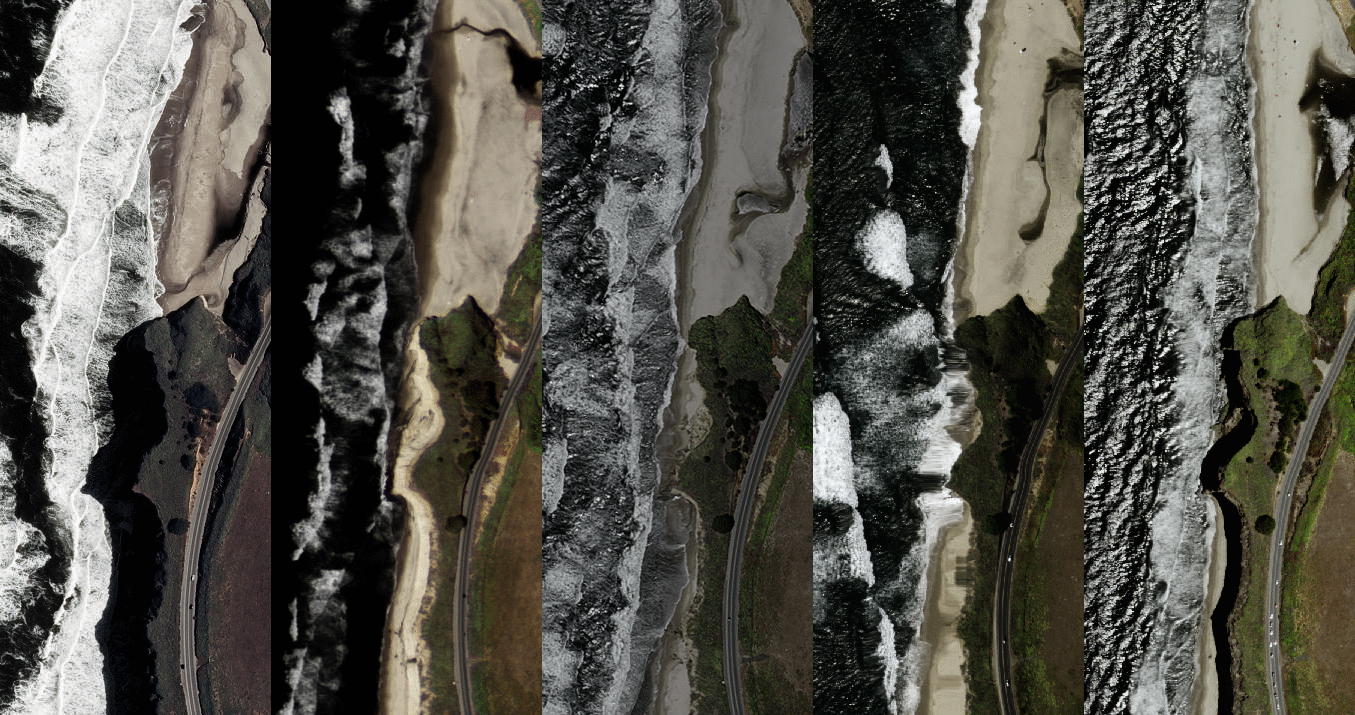
Example 2: -122.336059570, 37.119044184
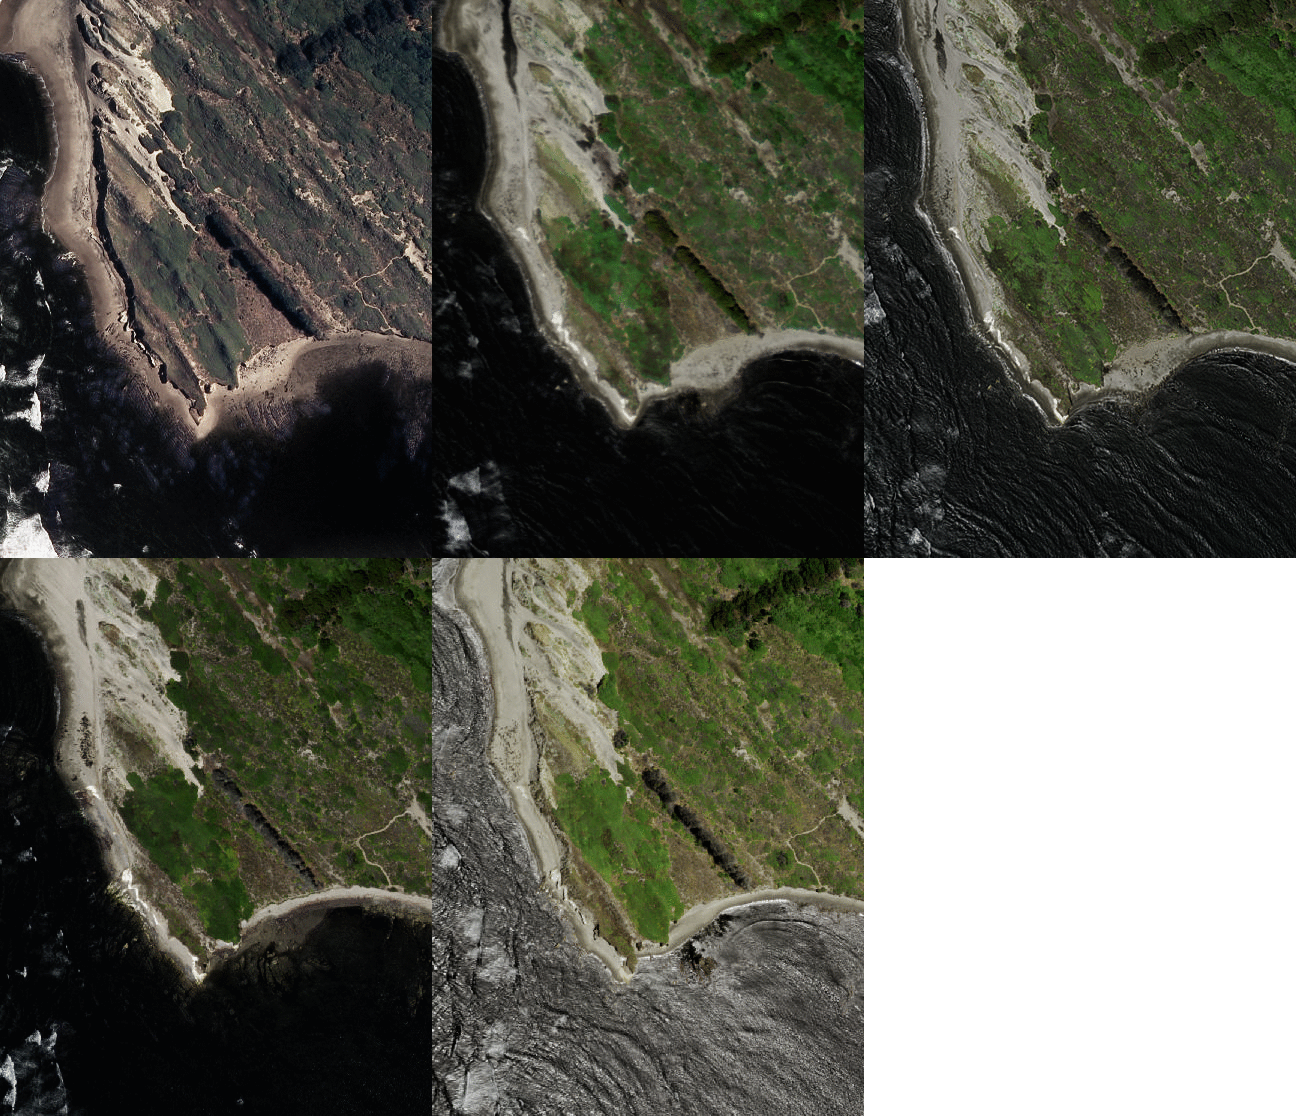
5. Big Sur
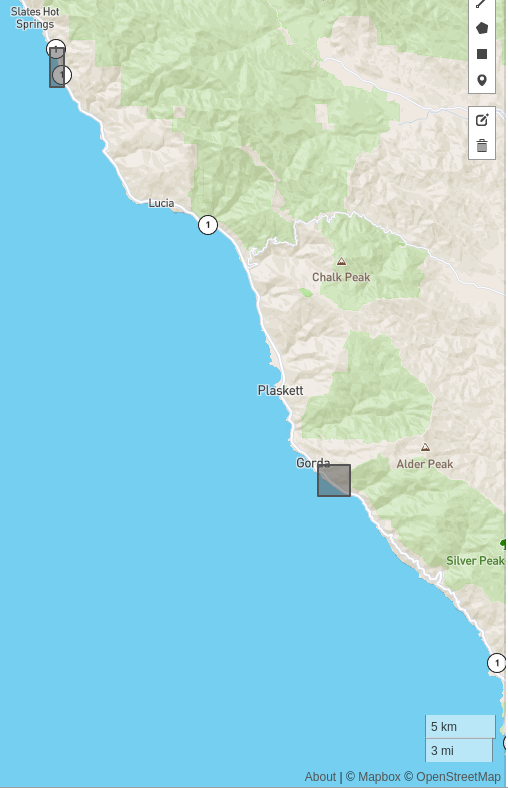
Example 1: -121.433996200. 35.864958674

Example 2: -121.623355865, 36.093859281
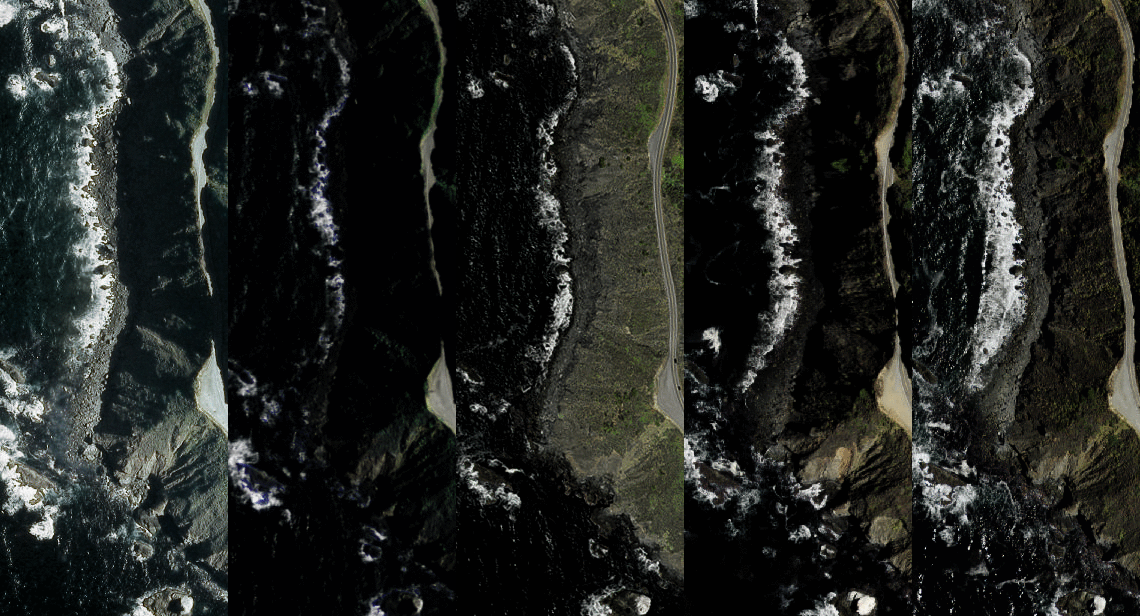
6. Monterey
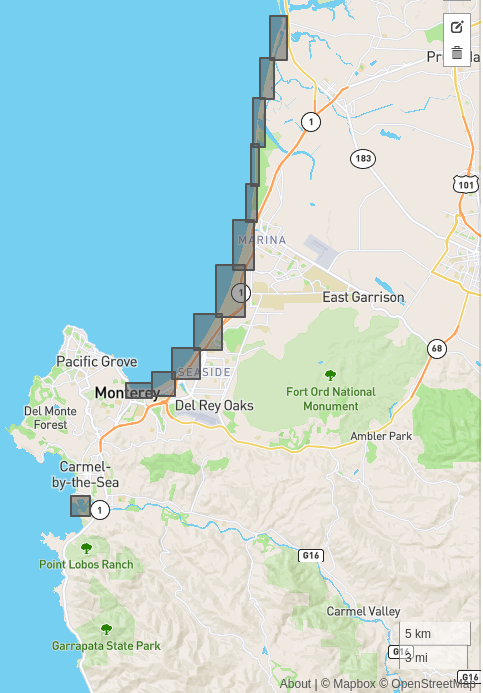
See this for more details
Example 1: -121.841022491, 36.631756358
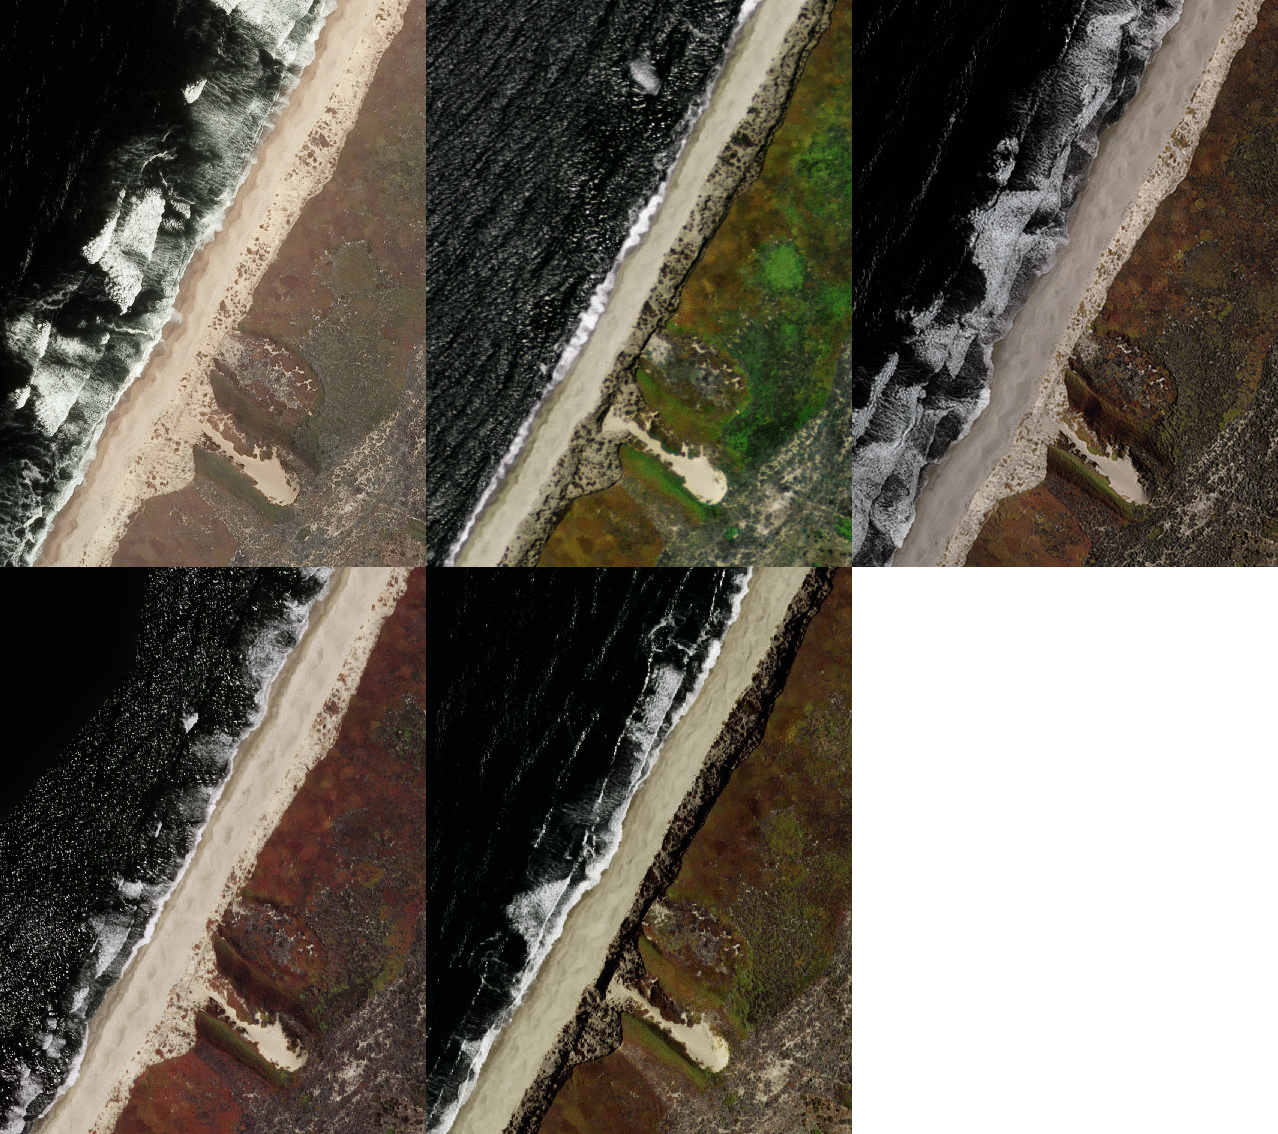
Example 2: -121.927986145, 36.536674148

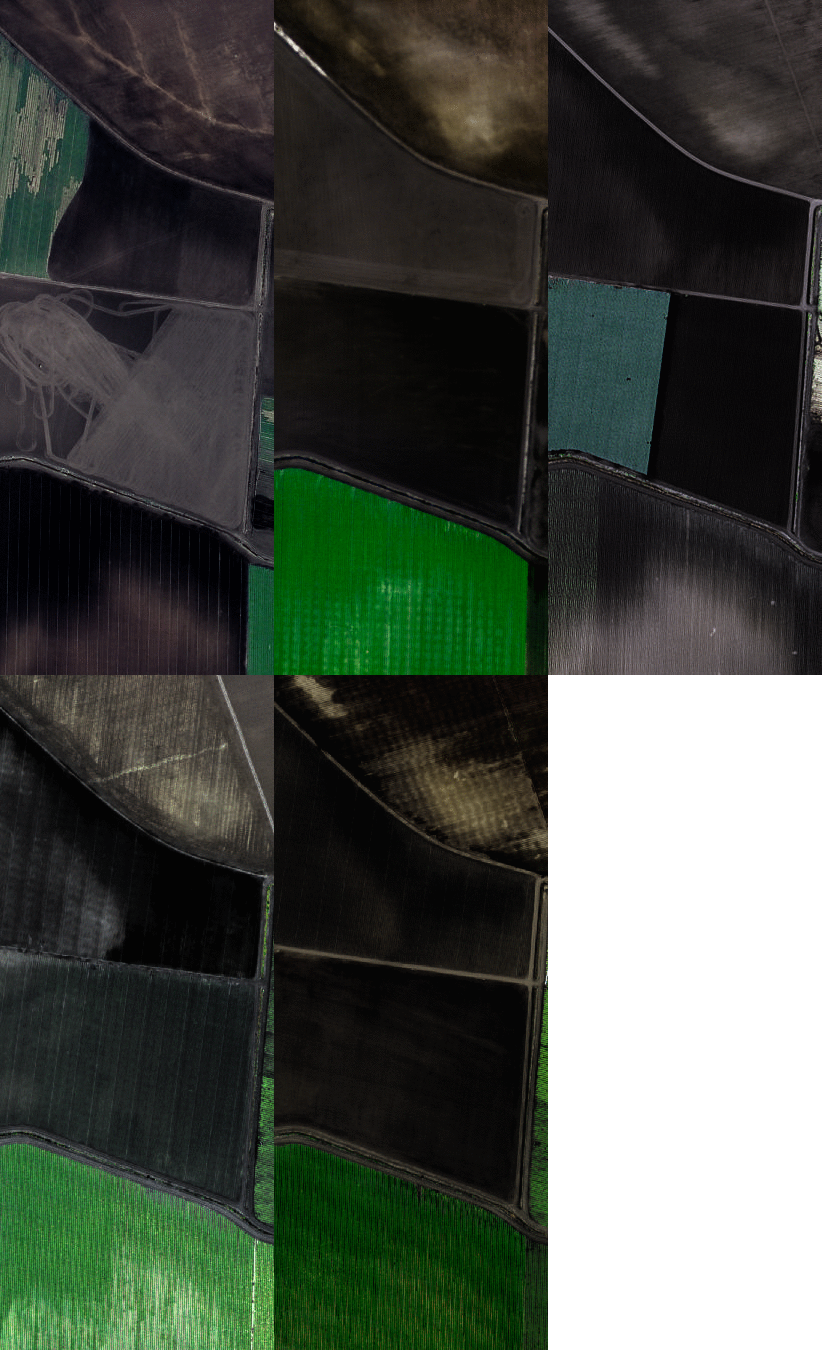
Example 3: -121.792098999, 36.793256839
7. Santa Barbara
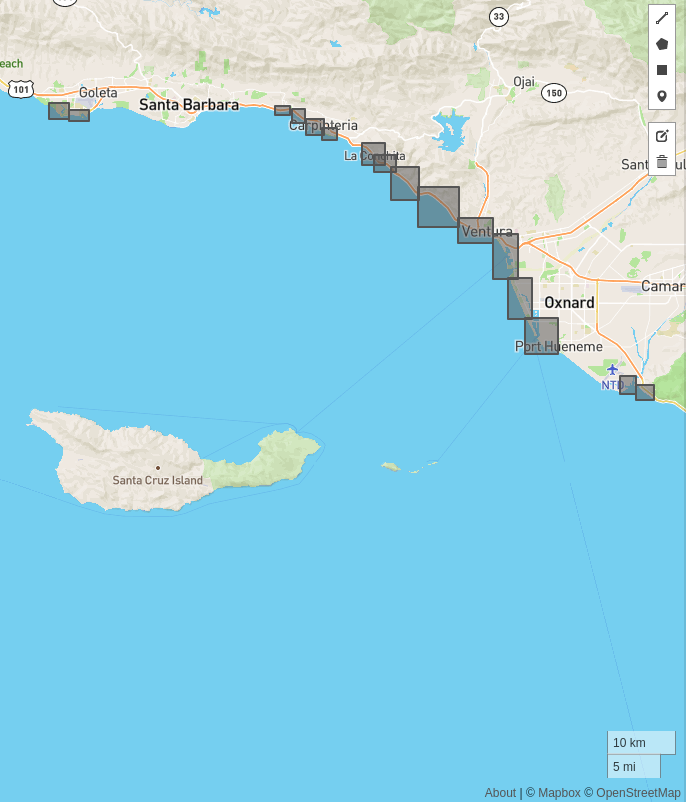
See, for example, this report
Example 1: -119.102336883, 34.101797729
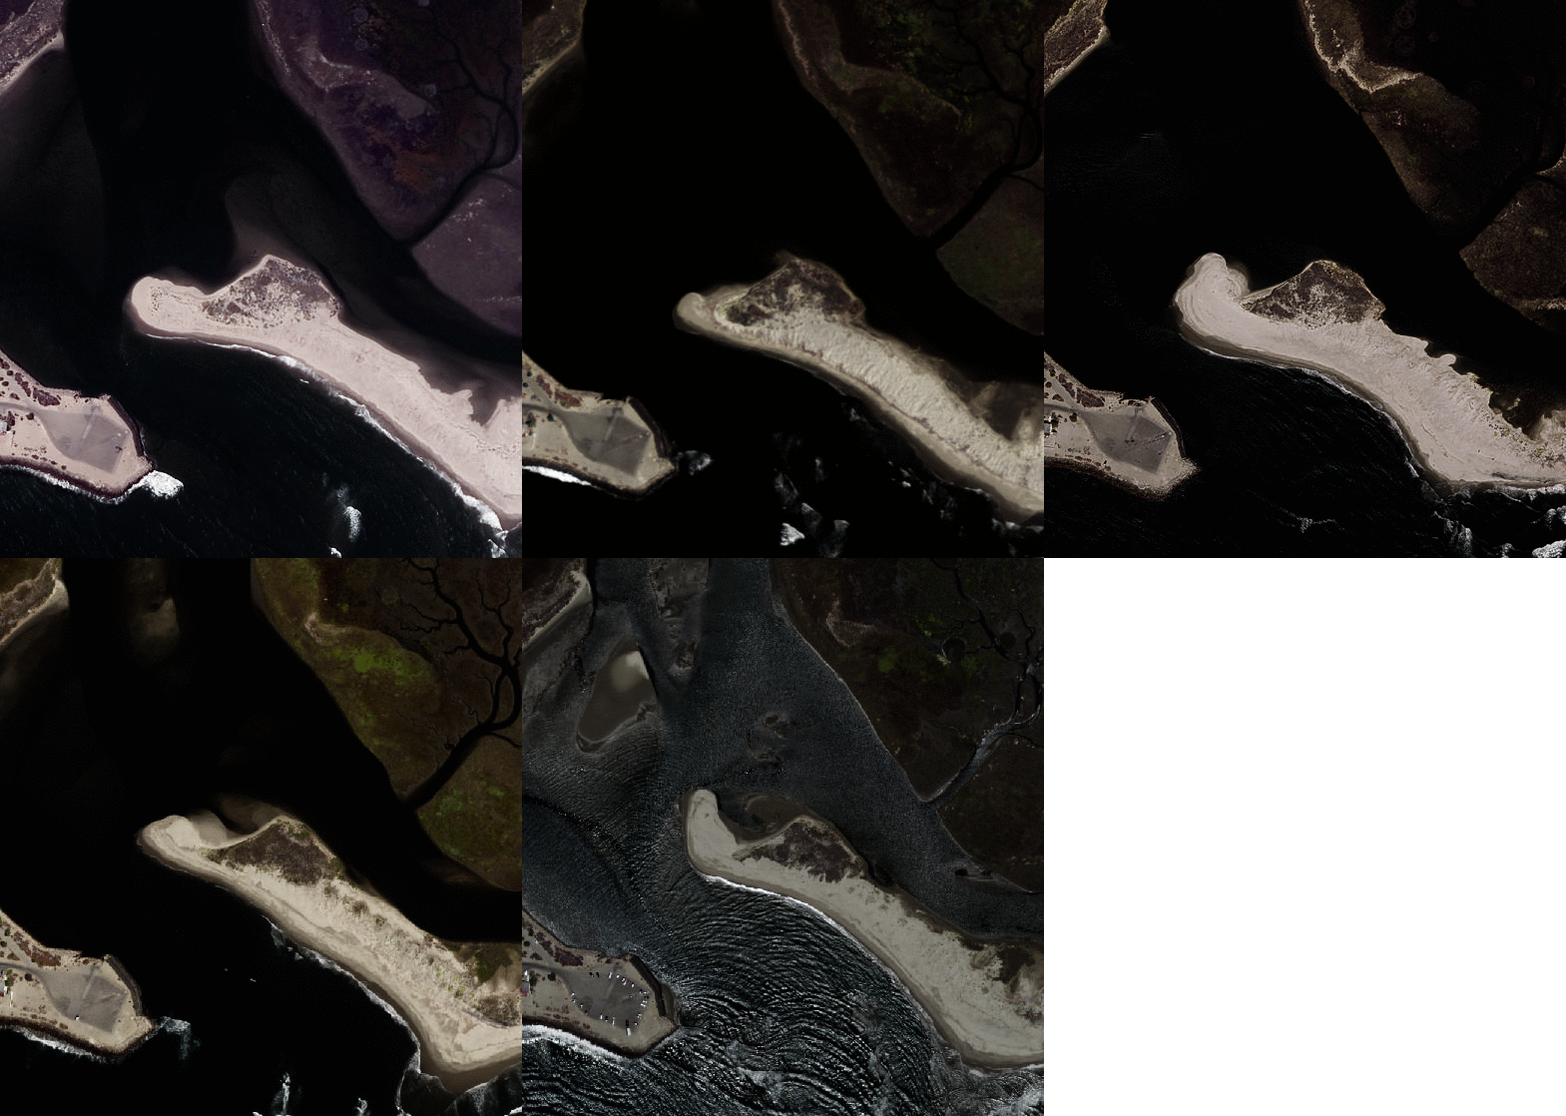
Example 2: -119.271972656, 34.244726235
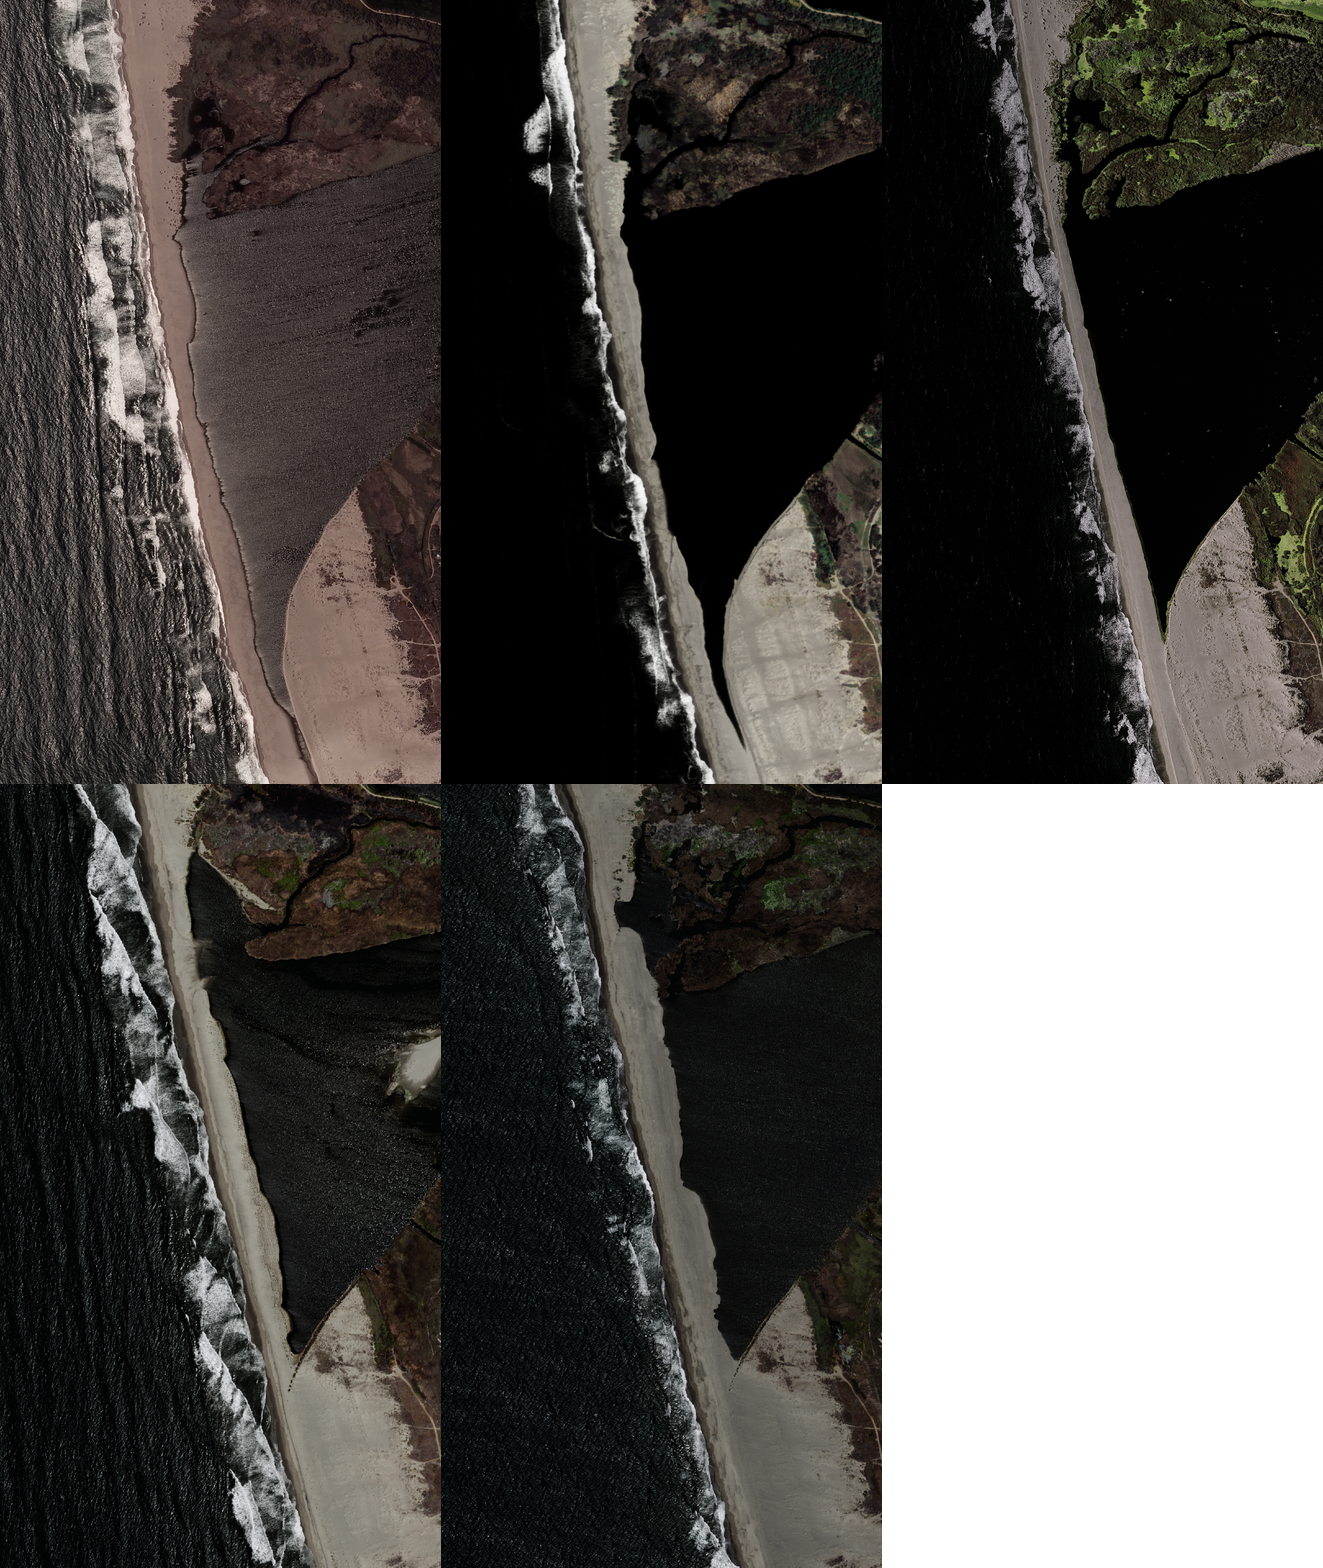
Example 3: -119.271972656, 34.244726235
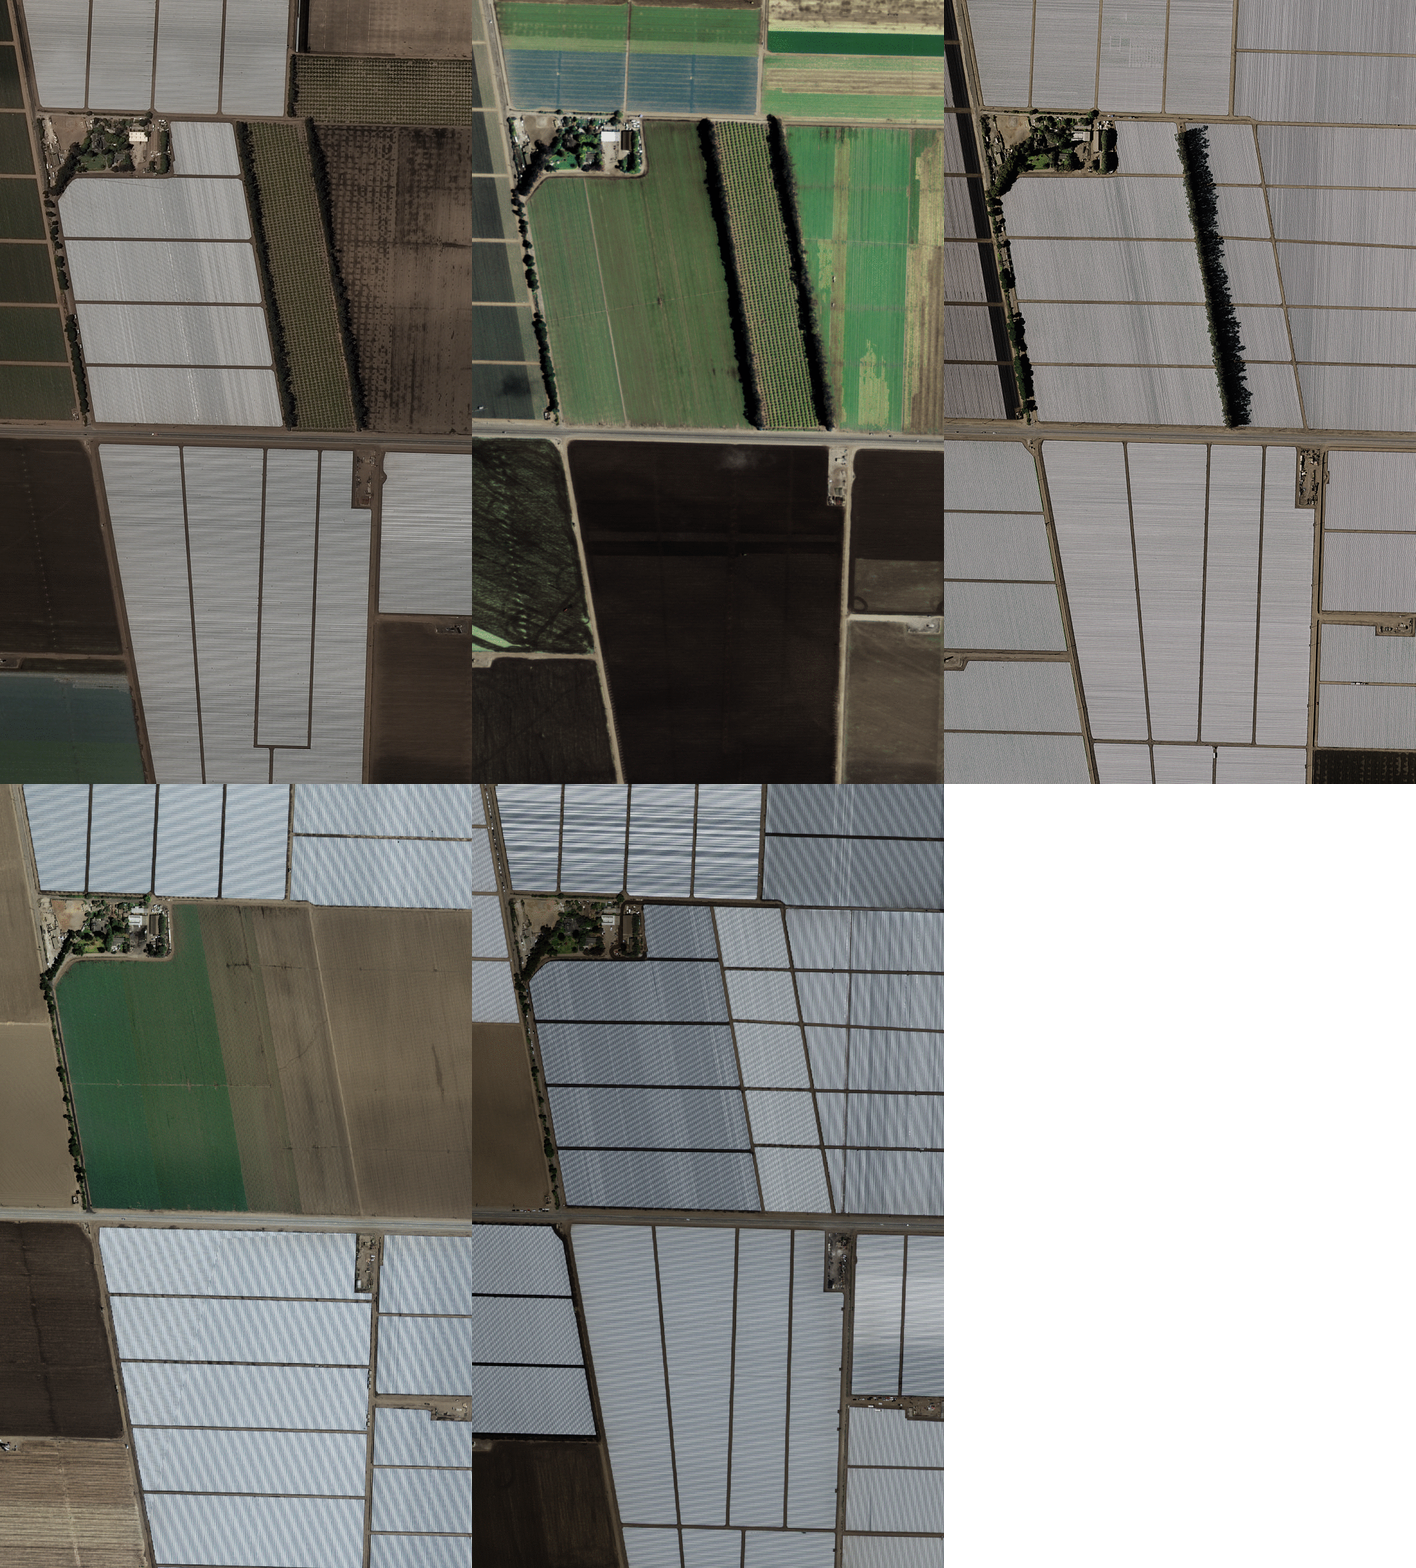
8. San Diego
Example 1: -117.271087646484 32.943915926484
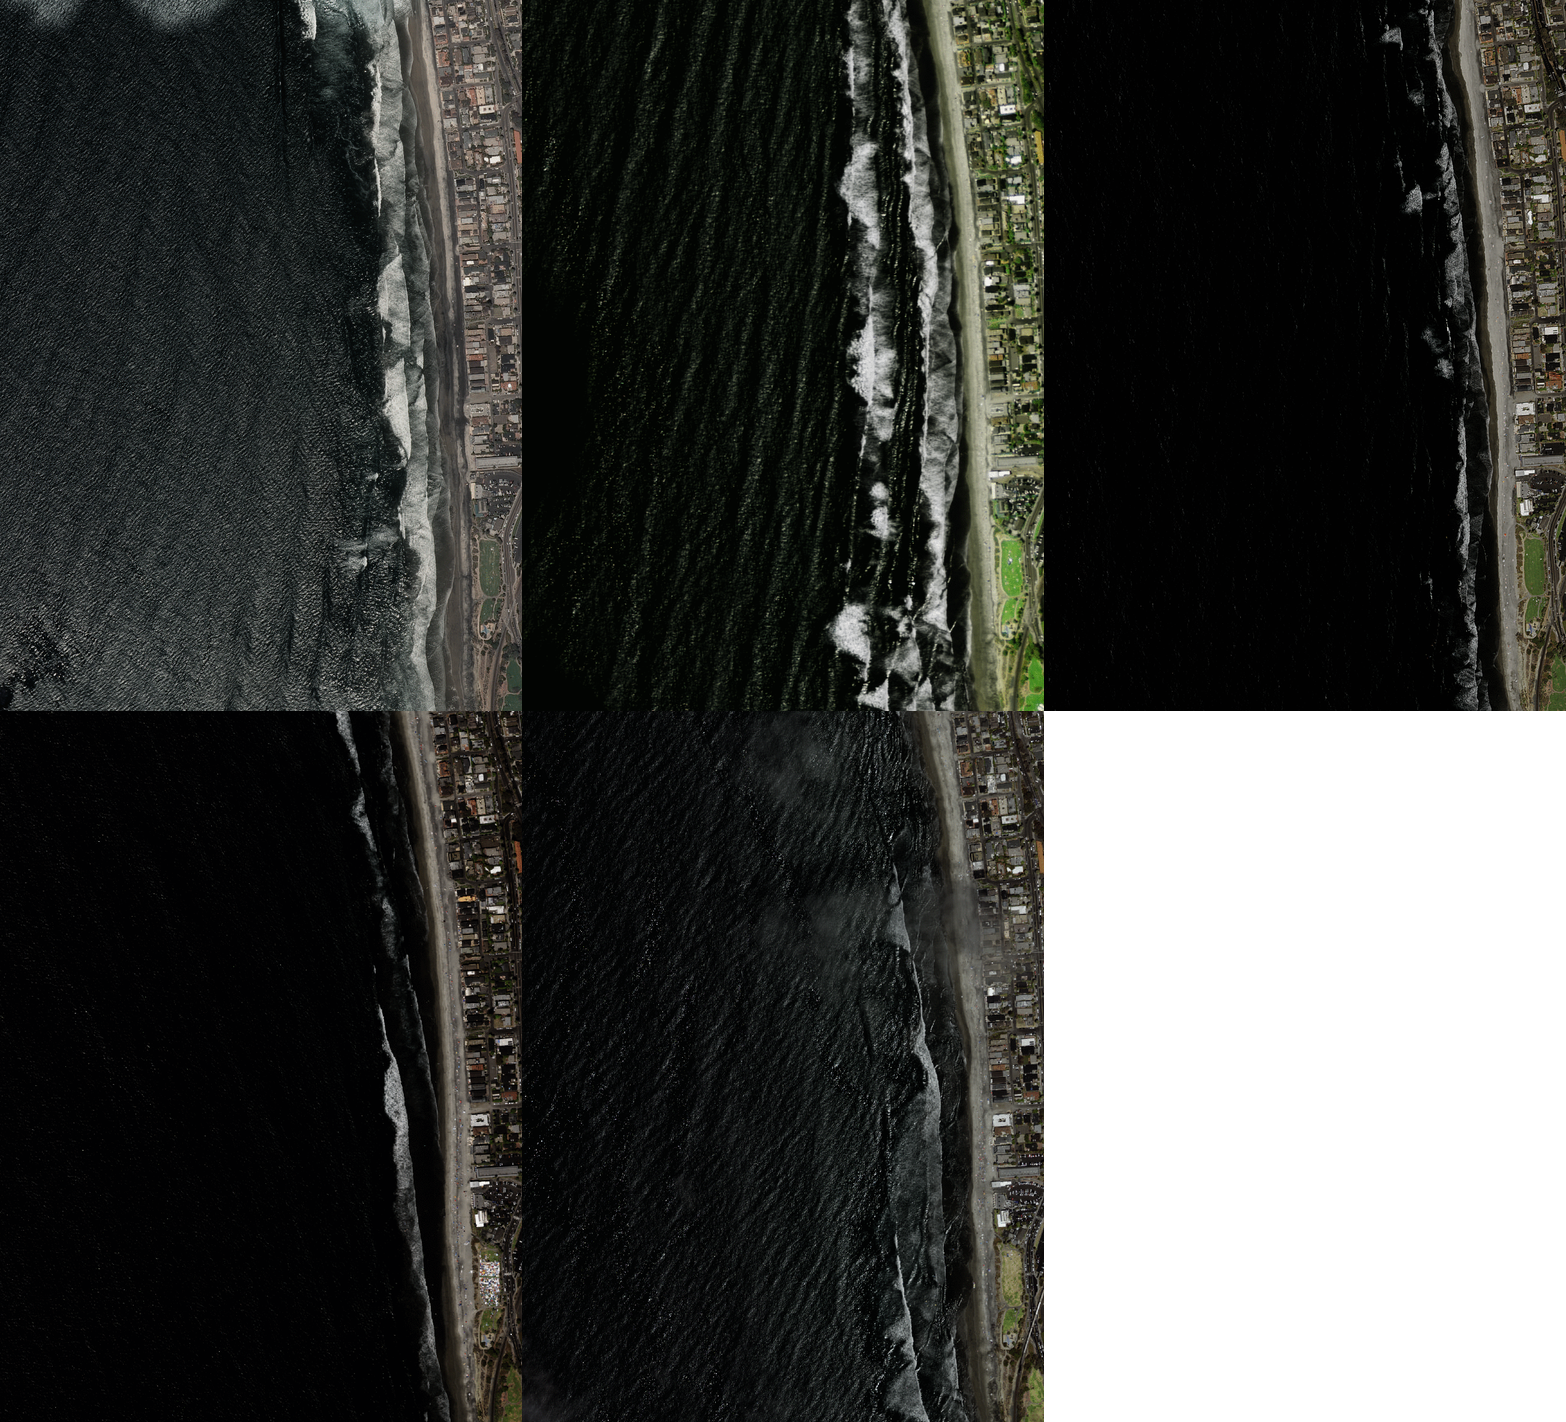
Example 2: -117.271087646484 32.943915926484
